Episode Transcript
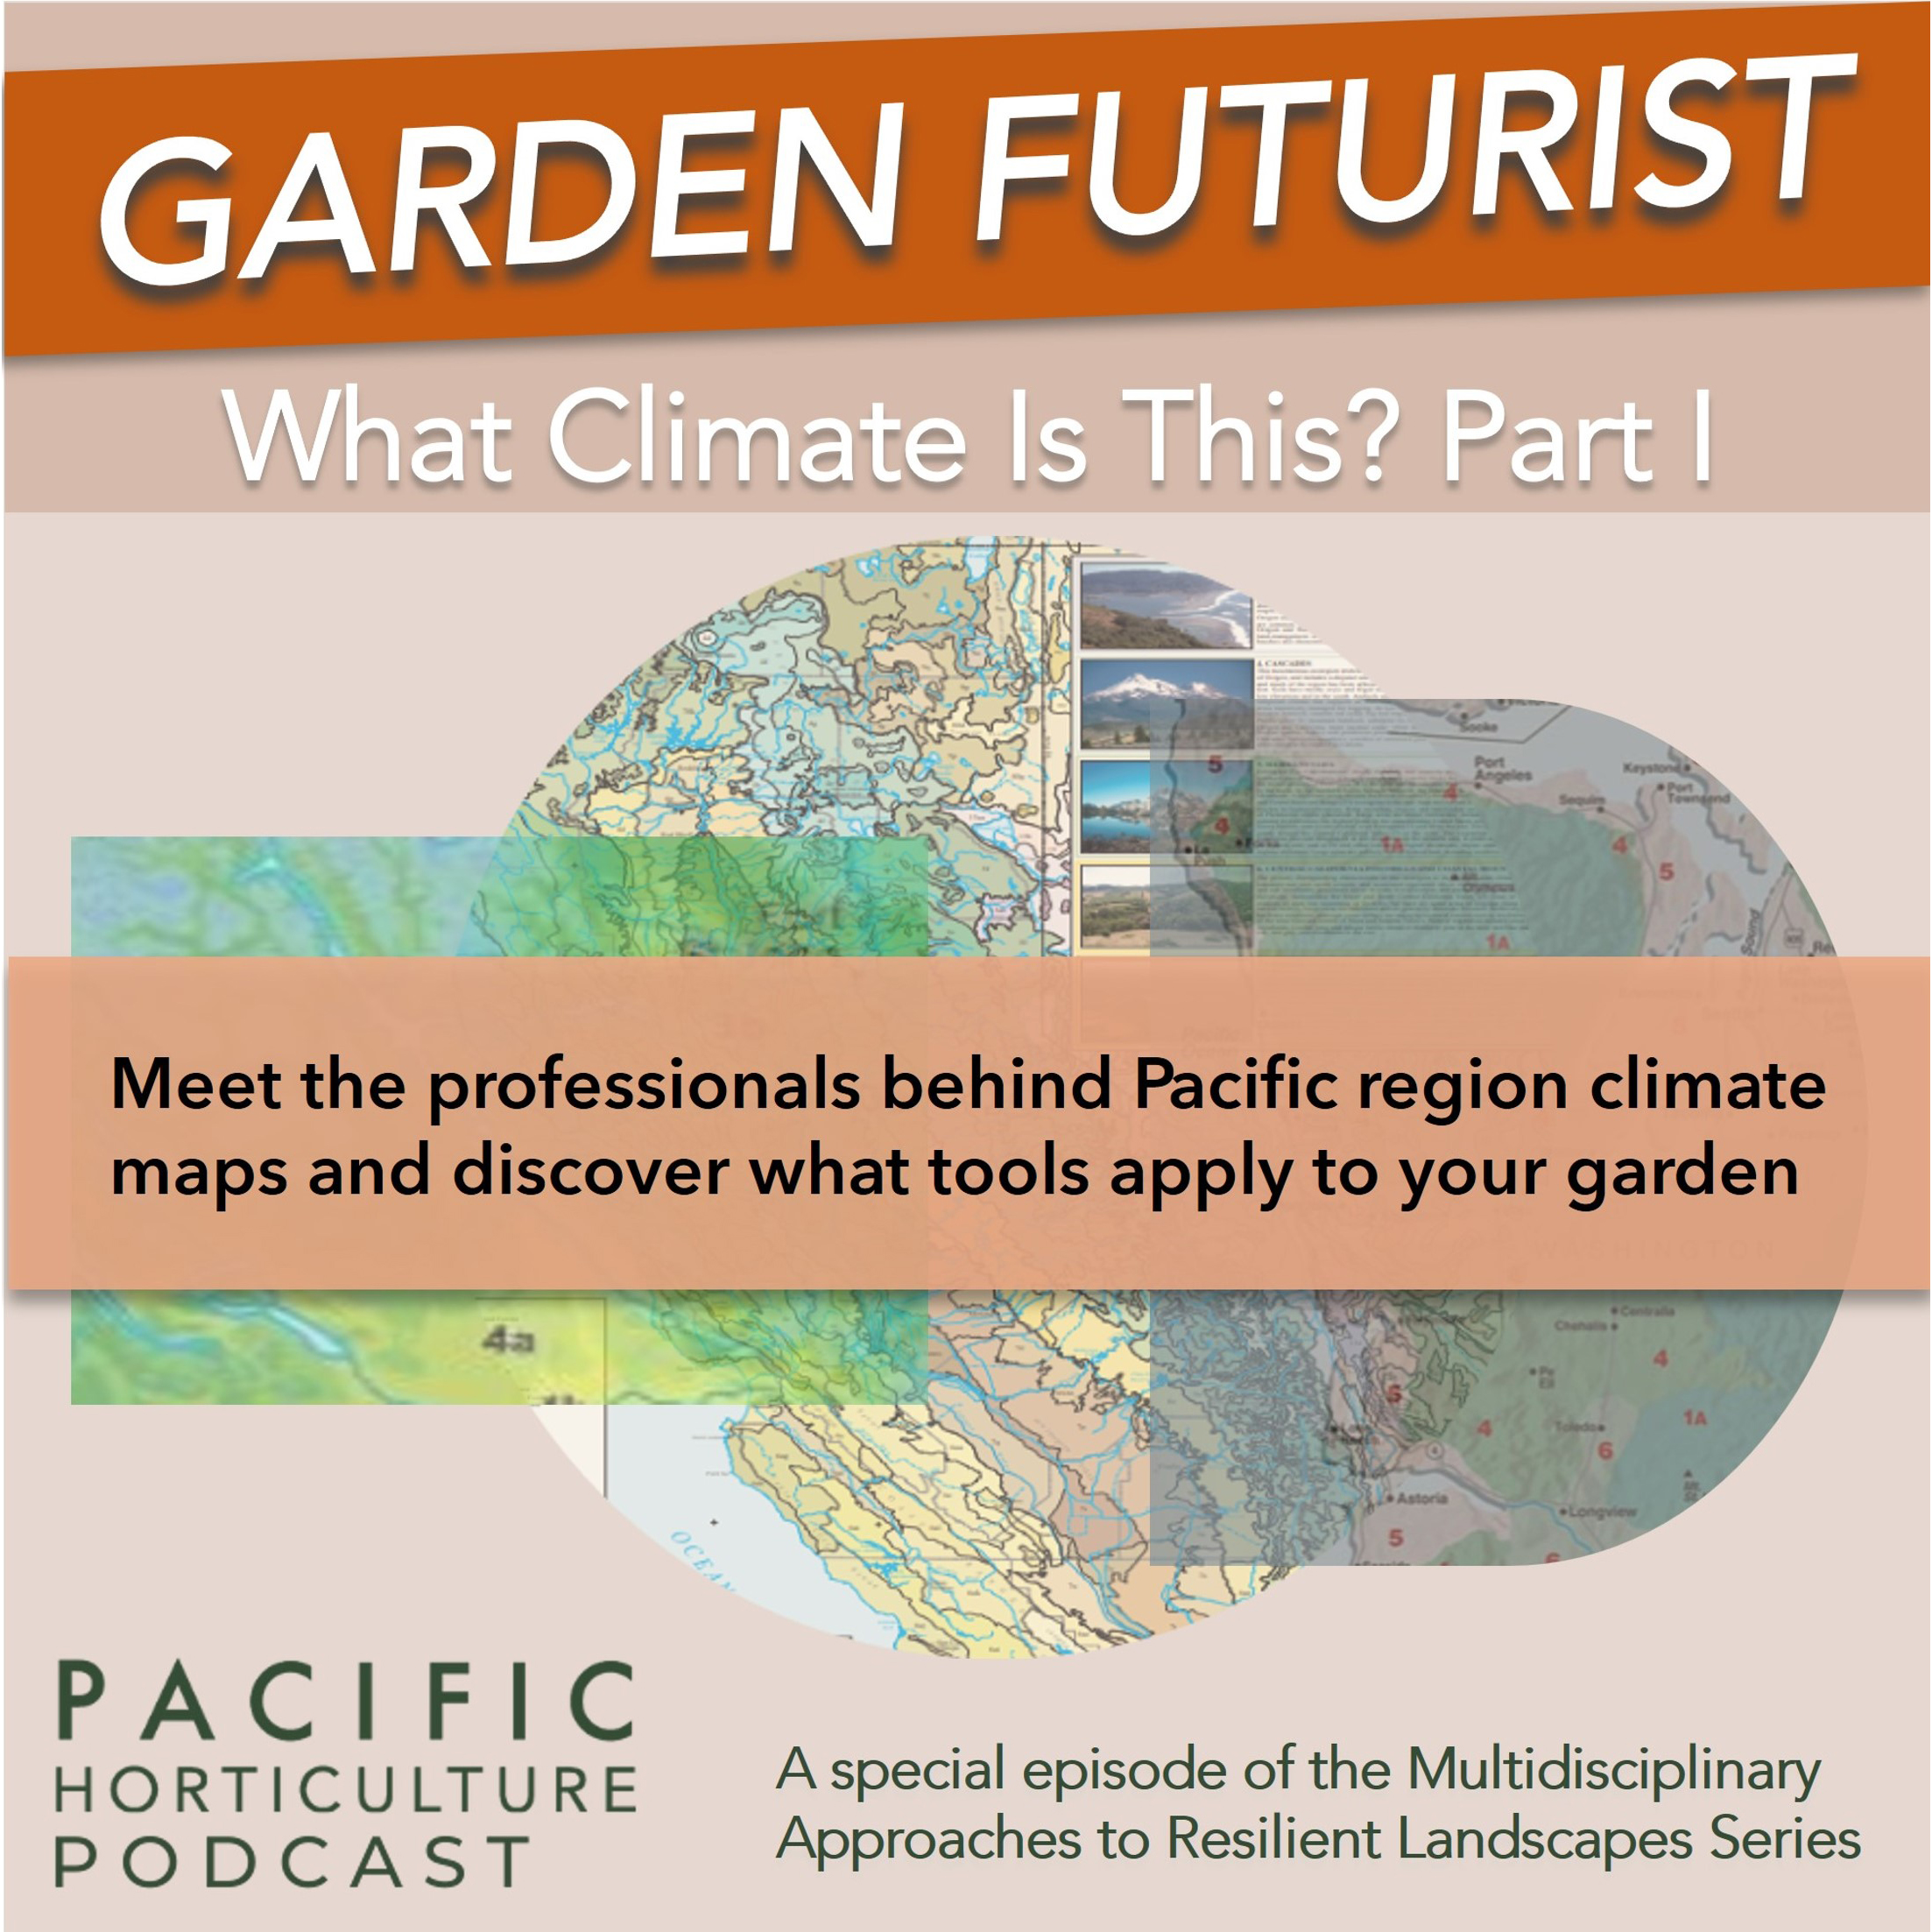
What Climate is This: Part One
Sarah Beck: Welcome to a special two-part episode of Garden Futurist called “What Climate Is This?” It is part of our series, “Multidisciplinary Approaches to Resilient Landscapes.”
If you live in the Pacific region, you know that seasons in your garden look different from the rest of North America. There are many potentially important factors and multiple systems for mapping zones in our region. Ecoregions, microclimates, hardiness, rainfall, soil types, elevation, chill hours, ecology. It goes on and on. You have likely observed that the Pacific Ocean annually influences weather patterns from the coast all the way to the mountains.
In an already complex region, climate scientists tell us that extreme changes are underway now. We held a conversation recently with a panel of experts working within the fields of climate science, ecoregion and hardiness mapping. As we listen to the panelists, we are going to attempt to frame this conversation through a horticultural lens.
Sarah Beck: Joining me to help with horticultural translation is Bart O’Brien, botanic garden manager at East Bay Regional Park District in Berkeley, California, and he is the recent award recipient of the Liberty Hyde Bailey Award, the American Horticultural Society’s highest award for significant lifetime contributions to horticulture.
And, also joining me will be Adrienne St. Clair, our own Garden Futurist co-producer. She is a botanist with a Pacific Northwest perspective. She sees a lot of this topic as it overlaps with ecological restoration work.
Adrienne and Bart both focus on native plants in their work and my conversations with them will bookend the portion of these two episodes with our “What Climate Is This?” panel.
I have asked Bart O’Brien to talk about what makes the Pacific region unique horticulturally, specifically from his perspective in California.
Bart O'Brien: Since I'm so California focused, I’m more mediterranean climate, and just how contrary it is to the rest of the world. So many people just don't understand that. Particularly people that have been here a long time don’t understand that our growing season is starting now. It'll be over in May, June, and then everything's just the equivalent, basically, of winter, but during the warm season.
Sarah Beck: Right.
Bart O'Brien: And that's why we have such an outdoor-focused lifestyle here in the West. It's dry in the summer. You can be outside doing anything, but yet our native plants, for the most part, are dormant. So that's why a lot of people get confused in dealing with our plants.
Sarah Beck: I find this to be very interesting on a couple of levels, because we in the entire Pacific region do have something hugely in common that we do not have in common with pretty much the rest of the North American continent, but it's not the mediterranean climate. That is one slice of it.
Bart O'Brien: The country was settled by Europeans east to west. All of the old infrastructure—education, gardening, horticulture—the majority comes from the East Coast, in particular, the Northeast, and in particular, then, European and British.
That's why Sunset was so successful. They turned the paradigm around and approached it from a Western centric. California, with its rich history of Asian influence, has been more of an amalgam of everything, all kinds of influences, starting in the ‘70s with a recognition of mediterranean climates, mediterranean climate plants, and bringing them to California.
And then the issues that that brought in, because California's mediterranean climate is different from the other four. I mean, we are colder, and we have the longest warm-dry period. It's just such a complex region, and again, how California was assembled geologically by terrains accumulating from the West. California itself, the highest of the conterminous US elevation and the lowest elevation in North America, all here.
They have a level of natural diversity, but nowhere near as much as you're going to have with a combination of latitude, altitude, geography, and geology just here. Even pre-European. There are more native people's languages in the West Coast than anywhere else in North America. We're diverse at every single level you can think of. And so it's not surprising why when people get here and start thinking about here, they do have to think differently, and approach things differently.
Sarah Beck: Let’s listen to Part One of my conversation with the panelists.
We have horticulture author and editor, Kathleen Norris Brenzel. We have Glenn Griffith from US Geological Survey, emeritus from Corvallis, Oregon. Dr. Ryan Longman, fellow at the East-West Center Pacific Island Development Program in Honolulu, Hawaii. And Dr. Dan McKenney, director of Integrated Ecology and Economics, Canadian Forest Service.
Again, Glenn is from the US Geological Survey, emeritus. He is the co-author of US Environmental Protection Agency Ecoregions. Now, Glenn, you are the co-author of Ecological Regions of North America, and your work combined components that are really relatively stable—soil and landform and major vegetation types—and also some less tangible characteristics, changing weather patterns and species dynamics and soil chemical processes.
I'm hoping to sort of pitch not a simple question to you at all, but really, I'm hoping you can give us just a sense of how, if there are simple ways of explaining this, how did your team manage to incorporate all these factors?
Glenn Griffith: Good question. I'll try to explain a little about our method and the type of characteristics that we could examine. First, I have to give tribute to Jim Omernik, who was a brilliant geographer with the EPA. He was the driver of that agency's mapping of ecoregions.
So he defined ecoregions in this way, anyway, kind of a simple way: areas within which ecosystems and the type, quality, and quantity of environmental resources are generally similar. It’s a pattern analysis. We look at spatial patterns of biotic, abiotic, aquatic, and terrestrial phenomena that affect or reflect differences in ecosystems. And we consider humans as part of the biota.
So it's a general-purpose framework. It's a weight-of-evidence approach. It integrates knowledge. It's not an overlay process. It uses all forms and sources of information that come in various scales and types. It includes the mental maps of local experts.
So that's kind of how you do it. There's a lot of ecoregion frameworks out there. The agencies have their own, you might hear of Bailey's ecoregions versus Omernik’s ecoregions and World Wildlife Fund, and of course there's no agreement. Everyone thinks their method is best. We're not so much looking at processes close up, or species dynamics, or food webs.
We get up close to like a lake ecosystem and study the heck out of it and measure all kinds of things. You really have to put that in context, and so you need to step back and see where that research area fits with the larger pattern of things. Eventually if you step back further, you start to see the whole picture, the forest for the trees, so to speak. And you see that some regions are very homogeneous and some regions are kind of heterogeneous, and some of these boundaries are very sharp and some of them are rather fuzzy. So it’s that kind of approach that's our artistic analogy to mapping ecoregions.
Sarah Beck: I think that a lot of mapmaking does have an element of art. So it’s beautiful to see that connection.
Let's go on to talk about some of the levels, the Level I, Level II, Level III, if we could, how these three levels show us something for the Pacific region specifically—Baja California, all the way to British Columbia and Hawaii—and how does how does this range of detail level really help us see different layers?
Glenn Griffith:. Yeah, so this is our most general Level I ecoregion. Very basic. We ended up with 15 regions at this basic level. So from south to north, we have our North American Deserts, Mediterranean California, Northwestern Forested Mountains, and our Marine West Coast Forest. It's pretty simple. Doesn't help us much in our local garden efforts.
Then we subdivide that into Level II regions. We have 50 regions for North America, and some of these Western West Coast regions weren't subdivided at that level because they just didn't pop out as being significant.
The more useful levels, I think, come at Level III and IV. At Level III, the regions that we know and are familiar with pop out: Sierra Nevada, Central Valley California, Klamath Mountains, Willamette Valley, Cascades, those broad regions that we see. If you look at things like land cover, which the USGS did a few years back, they had quite a few projects looking at land cover trends.
And then at Level IV, which gets us into the more close-up level, where we start to touch on our local soil patterns and microclimates and native plants and pollinators that influence our garden landscapes.
Sarah Beck: So actually I think that cues us up really nicely to jump to Hawaii now. Dr. Ryan Longman, fellow East-West Center at the Pacific Island Development Program in Honolulu, Hawaii. He's a collaborator on the Hawaiʻi. Climate Data Portal at University of Hawaiʻi.
Can you give us a brief introduction of the Hawaiʻi Climate Data Portal and the scope of climate information the portal covers?
Ryan Longman: I wanted to just introduce us by saying why do we need climate data? And there's a lot of different reasons why folks would need it on a lot of different scales.
It really helps us tell a story and what that story is depends on your application. But it helps us understand where we've come from and where we're headed. It allows us to make informed management decisions at all scales, also, even to the local garden scale. Provide justification for writing proposals. We need to tell that story to access financing, to do work in places in the Pacific and areas that are reliant on funding. It allows us to monitor ecosystem health and wellbeing at multiple scales. It allows us to monitor human health and wellbeing, and then we can create tools and resources that help us build adaptive capacities and resilience to changing conditions and a lot of other things.
Where I'm at in this process is all these different various parts of the data life cycle. I actually work with monitoring data, setting up climate stations to record information various places. And in Hawaii, you have continental scale gradients over a few kilometers. It's a really unique landscape in terms of the climatic gradients, how fast they change. Also data processing. So when you get that data, what do you do with it? How do you make it available?
So I consider this to be the life cycle. I'm involved in all these various capacities, and I'm getting to the point of the Hawaiʻi Climate Data Portal here, because the Hawaiʻi Climate Data Portal basically represents all of these different stages. But I also wanted to tee up another project that I'm working on called the Pacific Drought Knowledge Exchange, which is also really focused on the data dissemination part of this.
We're getting real-time telemeter data for temperature and rainfall. Right now we have monthly rainfall products. So last month's rainfall and yesterday's temperature, it's coming into the portal and you can get a snapshot of what happened yesterday or last month with the rainfall, and we're working towards having daily rainfall also.
We have a section on cultural resources, bring in the Indigenous knowledge perspective on climate.
Sarah Beck: I think you told me the last time we spoke, you could go down to the level of someone's individual piece of property, right?
Ryan Longman: For the rainfall. Yep. And you can just make a map of rainfall for last month or for any month you want, right? We are actually developing tools where folks can really get all this information for their individual, almost their backyard, but it's a 250-meter resolution, so it's usually a little bit bigger than someone's backyard.
And we're developing a tool through this Pacific Drought Knowledge Exchange project that allows folks to get these customized portfolios for their individual areas. You could do any scale you want and it gives you all this information: the elevational gradients, all the different climate information, seasonal climate graph, your seasonal rainfall temperature. You have information about drought, drought histories. And then we have the future projections. So how warm is it going to be, how wet is it going to be in mid-century and end century for these different geographies? And we pull out those numbers for these individual site-specific areas.
Sarah Beck: Let's jump now to Dr. Dan McKenney, who is and ecologist and an economist at Canadian Forest Service, co-author of Canadian Hardiness Zones and Climate Zone Mapping.
Dan McKenny: So we've got a plant hardiness site that reflects a few different elements of work that we've done through time, and it incorporates some climate mapping that we do as well. It’s quite similar in some respects to what Ryan does.
We use a tool called ANUSPLIN, which comes from Australia, where I did my PhD, developed by a guy named Michael Hutchinson. And we've used those models. Those models are what you call spatially continuous. So it allows us to get estimates of climate at any location where you have the longitude and latitude and elevation. If you don't have elevation, we can generate it using it as something called a digital elevation model, which is like a map of elevations.
So these models incorporate elevation, and allow us to generate historical climate and at daily time steps, monthly, longer-term averages. One of the great things about it is where we have plant observations, we can generate estimates of a suite of climate variables at exactly those locations.
So we basically are trying to use that to get the climatic signature of individual species. But the plant hardiness site that I'm talking about here incorporates not just that work, but hardiness zone maps.
So we've got a Made in Canada version, which basically uses seven climate variables. Things like minimum temperature of the coldest month, maximum temperature of the hottest month, frost-free period, rain. Rain in January, which up in our part of the world can be important thing. Snow, wind speed, a few things like that.
But also because in Canada, the nursery industry also uses the USDA single-variable approach of extreme minimum temperature. So we've replicated that for our part of the world.
Our models are continent-wide, so we're trying to cover the US, because there's lots of things that happen across the border. I work for the Forest Service, as you've mentioned. So while our focus is on trees for the most part, and ecosystems in natural settings, it wasn't that difficult for us, and it adds a little bit of public interest to be able to do this for other types of plants. So things like shrubs, vines, grasses, perennial flowers.
We've gathered, at this stage, observations for some 3 million plant species across the continent. So it includes Nature Conservancy data, US Forest Service data, various ecology. Master gardeners in parts of Canada can get points for adding their observations. Local horticulture clubs. And got models for over 3,000 species. It’s a work in progress.
We generate models for individual species. Once we get about 30 observations that are reasonably well separated. It's been shown that starts where you can start to get, depending on a few details, some robust models of individual species. Hardiness zone maps are generalizations of species models, if you like, that try to help people generalize what can grow where, right?
Here's the Canadian model. It incorporates topography. One of the things we've seen is this was developed originally in the 1960s by people at Agriculture Canada. Since then the climate has changed. We've updated it just using their same formula and we've seen big changes.
Definitely the zones are changing, and it's much more pronounced out West than it is out East, but that's very, very much along the lines of what's known about how climate is changing. And you guys are living in it out in California and parts of Pacific Northwest for sure.
We make use of climate data and work with some NOAA scientists to help develop our models, and Environment Canada, we work with a lot of people on that.
We're not trying to map out the natural range of species. We're trying to map out what can grow where, climatically speaking. Lots of other things involved, I want to make sure that's an important point.
Climatologists who worked for Environment Canada heard about what we were doing, said, “Oh, I'll put in what grows in our local arboretum.” So we've got data from arboretums that help to say what can grow where, right? So again, we can generate estimates at all these locations.
You can go to the website and generate a list of species whose climate envelopes cover any location in North America. I strongly believe that we need more data for Western North America.
Sarah Beck: I really appreciate you all doing this rapid-fire version of these conversations, because I know that you are sharing just massive amounts of information.
Kathleen Norris Brunell is a horticulture author and editor. She’s in the Bay Area in California and she's the editor of the past four editions of the Sunset Western Garden Book. A lot of folks before we came on, in our green room, were showing off. People are very proud of their old additions of the Sunset Western Garden Book. She was also a contributor on Sunset National Garden Book Climate Zone Map.
So Kathleen, welcome. I'm really specifically interested in the fact that Sunset very early on, I mean we're talking about the ‘50s this conversation started. It's so interesting. But Sunset looked at this region and said, we need to specifically support Western region gardeners.
Can you just talk a little bit about the factors that were considered in terms of climate ecology and why they did drill down on focusing on the West?
Kathleen Brenzel: This book on the left, that's the 1954 edition, the first edition of the Sunset Western Garden Book. And at that time, they only had 13 zones. But the impetus for creating this book was, “Wait a minute, winter lows don't really work for us.” We have the West's highest peaks, its lowest deserts, it's fog shrouded in June through summer months. Beaches, deep valleys. We go from conifer forest in the northwest to saguaro cactus in the south. And this jumbled terrain has got to create different gardening climates.
They had just the 13 climate zones and they showed the mean amount of rainfall, which showed a good part of California's Central Valley and the Southwest as totally dry in the winter.
I believe it was the 2001 edition I realized, “Okay, we've got Alaska and Hawaii in our readership zone. We travel there, we report on them a lot.” People in both places, gardeners, had asked us why they were not in the book, so I pushed for that and we got them in.
I did spend a lot of time in Alaska and realized around Anchorage, which is the most populous part of Alaska, their temperatures are moderated, of course, by the water. Wonderful gardeners. And I visited a lot of their gardens and they said, “Hey, why aren't we in the book? You've gotta give us some advice,” and that's why they're there.
I thought there's really interesting things happening in the West. While our early books started with just 13 states, because that's how many we were covering in the magazine and really focused on the low-rainfall areas, we began to refine our data and worked with and climate scientists really all over the West.
I thought it would be good to not only tell people what their zones are, but why are things happening that affect how they garden? For example, why are things happening that affect gardening in the fogs? Everybody always says, “Why is San Francisco so foggy?” And we wanted to explain that, “Well, the fog comes up to the coast and there's a little break by the Golden Gate Bridge, and it just flows in, and the heat in the interior is rising, so it draws the fog through.”
Well, all of these things really affect gardening, because of course in San Francisco you can grow beautiful rhododendrons and things like that. But as you in the east part of the bay and it's a little more of a struggle and they can burn and things like that. So we felt explaining this would really help people know how to garden in their various areas. So we call these little story maps that would help them along.
I mentioned that we brought Hawaii into the book in 2001. The reason was I had done a fellowship at the National Tropical Botanical Garden and I realized they have a lot of readers over there, too, And Hawaii is such a unique place, as you guys know. You have the weather that comes, the wet and the dry sides and the elevations where certain plants will grow that don't grow anywhere else in the world. I had done stories on Hawaii native plants, and that's really how I got into to bringing Hawaii into the book. First of all, there's a lot of endangered native plants there. And I wanted to shine a light on why that's so valuable, horticulturally. So we brought it in, we showed how you have the wet side, the dry side. There are certain plants that are evolved strictly to those conditions.
I had written an article for Sunset on Hawaii's native plants because I got over there. I did a fellowship at the National Tropical Botanical Garden and was just blown away by the beautiful plants there, the natives that grow nowhere else in the world. The Molokai ohaha (Brighamia rockii) that grows on cliffs on Molokai, and the silverswords (Argyroxiphium sandwicense ssp. macrocephalum) on the top of Mount Halelakala.
I went out to Kaena Point where, of course there's the beach naupaka (Scaevola taccada), and so many other plants that really grow only in that spot.
The dry lowland plants. There's few native forests there. I was lucky enough to go down into one of them, Waikamoi Preserve, with a fellow and look at some of the plants there that don't grow anywhere else in the world. And of course, the mesic forests, where so many endangered birds are living. And then the alpine areas.
So geographically and so many other ways. And the wet forest, of course, where things grow that won't grow on the dry side. So there is so much going on horticulturally in Hawaii and those ecoregions in such a compact area.
Sarah Beck: Now, we’re going to briefly speak with Bart O’Brien.
If we can look at all of these different tools that are on offer, there's just amazing, these maps and so much of it is like the live data. I’m super impressed by it. I think in some ways, maybe it's just fun as a nerd to explore, getting to know where you are.
But I think beyond that, I’m curious if there's anything that you would conclude about, okay, maybe here's a practical set of thoughts about what's available to you to get to know where you are and how do you approach thinking about that?
Bart O'Brien: Having data is always better than not having data. I do like all of the immediacy of temperature and rainfall data. We always sort of hear what the forecasts are on all of the weather apps and so on, but then when you go to those weather apps and try to look for, “okay, well how good was this forecast?” They won't tell you they're looking at the next week.
So yes, the fact that some of these do have all of that data available is great, because then you can sort of look at that and then look at these forecasters and say, “Well, yeah, this forecaster is much better than that forecaster, at least right now, or at least for my area,” and go with that.
Sarah Beck: Adrienne, I’d like to bring you into this conversation. We heard from really different specialists about a lot of mapping and tracking climate and ecological data, and I’m curious where you see some really direct application in some of the tools that they shared?
Adrienne St. Clair: The tool that I'm most familiar with, and that I use virtually on a daily basis, is the Level III ecoregions. If you do a quick search on the internet for Level III ecoregions, you'll come up with an image. No matter where you are in the United States, that image will resonate with you in some way because it's really information that we know and it's information that when you look at it and you look at your region, you already kind of know that it's a similar area.
So when I'm looking at the Portland metropolitan area, which is where I live, I can see that my Level III ecoregion extends down into Central Oregon, Willamette Valley, and then just a little bit up into Washington. And that kind of makes sense to me as I look at it. But the important thing that I take from that is that not only does it make sense to me socially in how I consider my environment, but it makes sense environmentally to the plants that I'm working with.
And so that's where I'm able to see that link between what I know, what I feel, and what the data say for how plants might be different from Central Willamette Valley down into, for instance, Southern Oregon, which is more closely related to Northern California.
So those Level III ecoregions are useful, both as a place maker and a sense of giving you this sense of place, but also it reiterates that the plants have that same sense of place that we kind of have, when you see that image of the area that you're in.
Sarah Beck: We have now set the stage for Episode Two of “What Climate is This?”
Join us because you won’t want to miss this next part of the conversation. We’ll get the panelists and our horticultural interpreters into a dialogue about hot topics like regional plant distribution and pushing boundaries as well as advice for how gardeners can look toward the unknown and play a role in the future.